Maximize learnings from a Kubernetes cluster failure
Since a number of months we (NU.nl development team) operate a small number of Kubernetes clusters. We see the potential of Kubernetes and how it can increase our productivity and how it can improve our CI/CD practices. Currently we run part of our logging and building toolset on Kubernetes, plus some small (internal) customer facing workloads, with the plan to move more applications there once we have build up knowledge and confidence.
Recently our team faced some problems on one of the clusters. Not as severe as to bring down the cluster completely, but definitely affecting the user experience of some internally used tools and dashboards.
Coincidentally, around the same time I visited DevOpsCon 2018 in Munich, where the opening keynote “Staying Alive: Patterns for Failure Management from the Bottom of the Ocean” related very well to this incident.
The talk (by Ronnie Chen, engineering manager at Twitter) focussed on various ways to make DevOps teams more effective in preventing and handling failures. One of the topics addressed was how catastrophes are usually caused by a cascade of failures, resulting in this quote:
A post-mortem that blames an incident only on the root cause, might only cover ~15% of the issues that led up to the incident.
As can be seen in this list of postmortem templates, quite a lot of them contain ‘root cause(s)’ (plural). Nevertheless the chain of events can be easily overlooked, especially as in a lot of situations, removing or fixing the root cause makes the problem go away.
So, let’s see what cascade of failures led to our incident and maximize our learnings.
The incident
Our team received reports of a number of services showing erratic behavior: Occasional error pages, slow responses and time-outs.
Attempting to investigate via Grafana, we experienced similar behavior affecting Grafana and Prometheus. Examining the cluster from the console resulted in:
$: kubectl get nodes
NAME                                          STATUS     ROLES     AGE       VERSION
ip-10-150-34-78.eu-west-1.compute.internal    Ready      master    43d       v1.10.6
ip-10-150-35-189.eu-west-1.compute.internal   Ready      node      2h        v1.10.6
ip-10-150-36-156.eu-west-1.compute.internal   Ready      node      2h        v1.10.6
ip-10-150-37-179.eu-west-1.compute.internal   NotReady   node      2h        v1.10.6
ip-10-150-37-37.eu-west-1.compute.internal    Ready      master    43d       v1.10.6
ip-10-150-38-190.eu-west-1.compute.internal   Ready      node      4h        v1.10.6
ip-10-150-39-21.eu-west-1.compute.internal    NotReady   node      2h        v1.10.6
ip-10-150-39-64.eu-west-1.compute.internal    Ready      master    43d       v1.10.6
Nodes NotReady, not good. Describing various nodes (not just the unhealthy ones) showed:
$: kubectl describe node ip-10-150-36-156.eu-west-1.compute.internal

<truncated>

Events:
  Type     Reason                   Age                From                                                     Message
  ----     ------                   ----               ----                                                     -------
  Normal   Starting                 36m                kubelet, ip-10-150-36-156.eu-west-1.compute.internal     Starting kubelet.
  Normal   NodeHasSufficientDisk    36m (x2 over 36m)  kubelet, ip-10-150-36-156.eu-west-1.compute.internal     Node ip-10-150-36-156.eu-west-1.compute.internal status is now: NodeHasSufficientDisk
  Normal   NodeHasSufficientMemory  36m (x2 over 36m)  kubelet, ip-10-150-36-156.eu-west-1.compute.internal     Node ip-10-150-36-156.eu-west-1.compute.internal status is now: NodeHasSufficientMemory
  Normal   NodeHasNoDiskPressure    36m (x2 over 36m)  kubelet, ip-10-150-36-156.eu-west-1.compute.internal     Node ip-10-150-36-156.eu-west-1.compute.internal status is now: NodeHasNoDiskPressure
  Normal   NodeHasSufficientPID     36m                kubelet, ip-10-150-36-156.eu-west-1.compute.internal     Node ip-10-150-36-156.eu-west-1.compute.internal status is now: NodeHasSufficientPID
  Normal   NodeNotReady             36m                kubelet, ip-10-150-36-156.eu-west-1.compute.internal     Node ip-10-150-36-156.eu-west-1.compute.internal status is now: NodeNotReady
  Warning  SystemOOM                36m (x4 over 36m)  kubelet, ip-10-150-36-156.eu-west-1.compute.internal     System OOM encountered
  Normal   NodeAllocatableEnforced  36m                kubelet, ip-10-150-36-156.eu-west-1.compute.internal     Updated Node Allocatable limit across pods
  Normal   Starting                 36m                kube-proxy, ip-10-150-36-156.eu-west-1.compute.internal  Starting kube-proxy.
  Normal   NodeReady                36m                kubelet, ip-10-150-36-156.eu-west-1.compute.internal     Node ip-10-150-36-156.eu-west-1.compute.internal status is now: NodeReady
It looked like the node’s operating system was killing processes before the kubelet was able to reclaim memory, as described in the Kubernetes docs.
The nodes in our cluster are part of an auto-scaling group. So, considering we had intermittent outages and at that time had problems reaching Grafana, we decided to terminate the NotReady nodes one by one to see if new nodes would remain stable. This was not the case, new nodes appeared correctly but either some existing nodes or new nodes quickly got into status NotReady.
It did result however, in Prometheus and Grafana to be scheduled at a node that remained stable, so at least we had more data to analyze and the root cause became apparent quickly…
Root cause
One of the dashboards in our Grafana setup shows cluster-wide totals as well as a graphs for pod memory and cpu usage. This quickly showed the source of our problems.
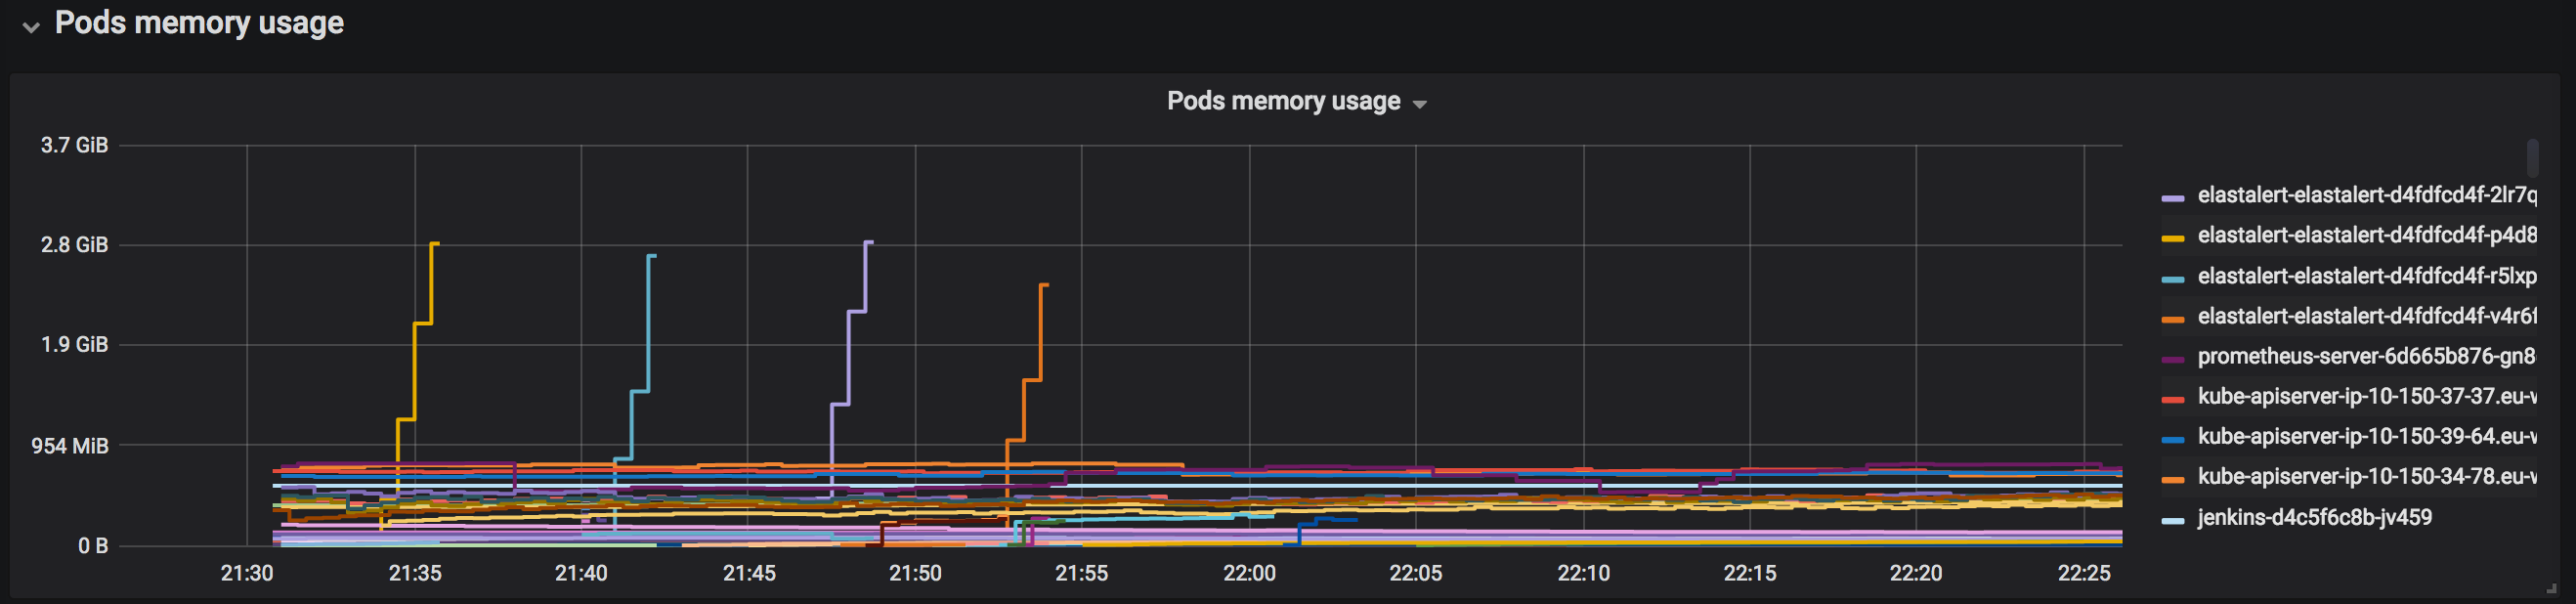
Pods memory usage, during and after incident
Those lines going up into nowhere are all pods running ElastAlert. For logs we have an Elasticsearch cluster running, and recently we had been experimenting with ElastAlert to trigger alerts based on logs. One of the alerts that was introduced shortly before the incident was an alert that would fire if our Cloudfront-* indexes would not receive new documents for a certain period. As the throughput of that Cloudfront distribution is a couple of millions of request/hour, this apparently caused an enormous ramp up in memory usage. In hindsight, digging deeper into documentation, we’d better have used use_count_query and/or max_query_size.
Cascade of failures
So, root cause identified, investigated and fixed. Incident closed, right? Keeping in mind the quote from before, there’s is still 85% of learnings to be found, so let’s dive in:
No alerts fired
Obviously we were working on alerting as the root cause was related to ElastAlert. Some data to act on is (currently) only available in Elasticsearch, like log messages (occurence of keywords) or systems outside of the Kubernetes cluster. Prometheus also has an alertmanager which we still need to set up. Besides those two sources we use New Relic for APM. Regardless of the sources and possibly the need to converge, it starts with defining alert rules.
Resolution:
- Define alerts related to resource usage, like CPU, Memory and disk space.
- Continue research on alerting strategy that effectively combines possibly multiple sources.
Grafana dashboard affected by cluster problems
Prometheus and Grafana are very easy to set up in a Kubernetes cluster (Install some helm charts and you’re pretty much up and running). However, if you can’t reach your cluster, you’re blind.
Resolution:
- Consider exporting metrics outside of cluster and move Grafana out of cluster as well. This is not without downsides though as very well explained in this article at robustperception.io. An advantage might be having a single go-to point for dashboards for multiple clusters. to my knowledge Kublr uses a similar set-up to monitor multiple clusters.
- Out-of-cluster location could be EC2 but also a separate Kubernetes cluster.
Not fully benefiting from our ELK stack
We are running an EC2-based ELK stack that ingests a big volume of Cloudfront logs. But also logs and metrics from the Kubernetes clusters, exported by filebeat and metricbeat daemonsets. So, the data we couldn’t access via the in-cluster Grafana, existed in the ELK stack as well…. but either wasn’t visualized properly or was overlooked.
This in general is a somewhat tricky subject: Elasticsearch on the one hand is likely to be needed anyway for centralized logs and can do metrics as well so it could be the one-stop solution. However at scale it’s quite a beast to operate and onboarding could really benefit from more example dashboards (imo).
On the other hand, Prometheus is simple to set up, seems to be the default technology in the Kubernetes eco-system and, paired with Grafana’s available dashboards, is very easy to get into.
Resolution:
- Either visualize important metrics in ELK or improve Prometheus/Grafana availability.
- Improve metrics strategy.
No CPU & memory limits on ElastAlert pod
The Helm chart used to install ElastAlert allows specifying resource requests and limits, however these do not have default values (not uncommon) and were overlooked by us.
In order to enforce configuring resource limits we could have configured default and limit memory requests for our namespace.
Resolution:
- Specify resource limits via Helm values.
- Configure namespaces to have defaults en limits for memory requests.
Ops services affecting customer facing workloads
Customer workloads and monitoring/logging tools sharing the same set of resources has the risk of an amplifying effect consuming all resources. Increased traffic, causing increased CPU/memory pressure, causing more logging/metric volume, causing even more CPU/memory pressure, etc.
We were already planning to move all logging, monitoring and CI/CD tooling to a dedicated node group within the production cluster. Depending on our experience with that, having a dedicated ‘tools’ cluster is also an option.
Resolution (was already planned):
- Isolate customer facing workloads from build, logging & monitoring workloads.
No team-wide awareness of the ElastAlert change that was deployed
Although the new alert passed code review, the fact that it was merged and deployed was not known to everybody. More important, as it was installed via the command line by one of the team members, there was no immediate source of information that showed what applications in the cluster might have been updated.
Resolution:
- Deploy everything via automation (e.g. Jenkins pipelines)
- Consider a GitOps approach for deploying new application versions: ‘state to be’ and history of changes in code, using a tool well known by developers.
No smoke tests
If we had deployed the ElastAlert update using a pipeline, we could have added a ‘smoke test’ step after the deploy. This could have signalled excessive memory usage, or pod restarts due to the pod exceeding configured memory limits.
Resolution:
- Deploy via a pipeline that includes a smoke test step.
Knowledge of operating Kubernetes limited to part of team
Our team (as most teams) consist of people with various levels of expertise on different topics. Some have more Cloud & DevOps experience, some are front-end or Django experts, etc. As Kubernetes is quite new technology, and certainly for our team, knowledge was not as widespread as is desirable. As with all technologies practiced by Agile teams: DevOps should not be limited to a single (part of a) team. Luckily experienced team members were available to assist the on-call team member that had little infrastructure experience.
Resolution (was already planned):
- Ensuring Kubernetes-related work (cloud infrastructure-related in general actually) is part of team sprints and is picked up by all team members, pairing with more experienced members.
- Workshops deep-diving into certain topics.
Wrap up
As becomes quite apparent, fixing the ElastAlert problem itself was just the tip of the iceberg. There was a lot more to learn from this seemingly simple incident. Most points listed in this article were already on our radar in one way or the other but their importance was emphasized.
Turning these learnings into scrum (or kanban) items will allow us to improve our platform and practices in a focused way and measure our progress.
Learning and improving as a team requires a company culture that allows ‘blameless post mortems’ and does not merely focus on ‘number of incidents’ or ‘time to resolve’. To finish with a quote heard at a DevOps conference:
Success consists of going from failure to failure without loss of enthusiasm - Winston Churchill